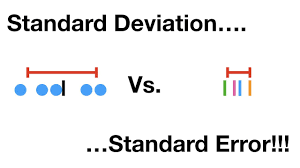
Standard Error of the Mean vs. Standard Deviation: The Difference
Aug 31, 2024 By Kelly Walker
Advertisement
Are you trying to understand the difference between the standard error of the mean (SEM) and standard deviation (SD)? If so, then this post is for you! This blog post will give an overview of what SEM and SD are and explain how they differ. We will also provide examples to illustrate these differences so that you can better understand their importance. This in-depth guide should equip you with the knowledge to confidently decide which measure of variability to use in various circumstances.
What is the mean, standard deviation (SEM)?
The standard error of the mean (SEM) estimates the variability inherent in a sample statistic. It measures how much the mean of a sample would vary if it were obtained multiple times. The SEM is typically used to calculate confidence intervals around a given data set and indicates the reliability or precision of a particular sample statistic. The SEM is generally calculated by taking the standard deviation of a sample and dividing it by the square root of the sample size.
What is the standard deviation (SD)?
The standard deviation (SD) measures how much variation or dispersion exists from the average or mean value in a set of data values. It is calculated by taking the square root of the variance of a data set. The SD is used to measure how spread out the values in a dataset are from the mean, and it can be used to compare different sets of datasets.
Differences between SEM and SD:
The main distinction between standard deviation (SD) and standard error of the mean (SEM) is that the former gauges the degree of variation for a single set of data values. At the same time, the latter assesses the variability in any given sample statistic, such as the mean. Another distinction is that whereas SEM provides insight into the accuracy or dependability of a certain sample statistic, standard deviation reflects how evenly distributed values are. Finally, SEM is often determined by taking the standard deviation and dividing it by the square root of the sample size, while SD is obtained by taking the square root of the variance of a data set.
How are SEM and SD used in statistics?
Standard deviation and standard error of the mean are commonly used in statistics to describe variability. Standard deviation is often used to measure how to spread data values from their mean. In contrast, SEM is typically used to calculate confidence intervals which indicate the reliability or precision of a particular sample statistic. Additionally, SEM can be used to compare different data sets and determine whether their difference is statistically significant.
The standard error of the mean (SEM) and standard deviation (SD) are two measures of variability used in statistics. While SD measures how much variation or dispersion exists from the average or mean value in a set of data values, SEM estimates the variability inherent in a sample statistic such as the mean.
When should you use SEM vs. SD in your research studies or data analysis projects?
Standard deviation should be used when measuring how far a particular set of data values is from the mean. On the other hand, the standard error of the mean should be used when calculating confidence intervals around a sample statistic, such as the mean, and for comparing different sets of datasets. As with any statistical analysis or research study, it is important to understand which measure of variability is most appropriate for your particular use case before deciding which one to use.
That concludes this in-depth guide on the differences between SEM and SD. We hope this has provided you with a better understanding of the different uses and implications of these two measures of variability so that you can make better-informed decisions in your data analysis projects.
Are there any situations when it's best to use one measure over the other?"
In certain situations, it is best to use one measure of variability over the other. For example, if you want to calculate confidence intervals around a sample statistic such as the mean, then SEM is typically the better option. Additionally, if you are comparing different sets of datasets, SEM is generally preferred due to its ability to determine if the difference between them is statistically significant. On the other hand, if you only need to measure how far from the mean a particular set of data values is, then the standard deviation would be more appropriate. Ultimately, it is important to understand which measure of variability is most suitable for your particular use case before deciding which one to use.
Standard deviation and standard error of the mean are both measures of variability used in statistics and data analysis projects. Still, there are situations where one measure is more suitable than the other. Understanding which measure of variability best fits your particular use case is important before deciding which one to use. That way, you can make more informed decisions in your data analysis projects and be sure that the results are as accurate as possible.
FAQs
How Can You Compute the SE From the SD?
The standard error of the mean (SE) can be calculated from the standard deviation (SD) by taking the SD and dividing it by the square root of the sample size. This calculation will estimate how much variability exists in a sample statistic, such as the mean, relative to that expected if obtained from an infinite number of samples.
What Does the SD Measure?
The standard deviation (SD) measures how much variation or dispersion exists from the average or mean value in a set of data values. This is useful for understanding the spread of data points and can be used to identify outliers that require further investigation. Additionally, it is often used to measure the quality of a process or system by looking at how much variation exists between different instances.
What Does the SEM Measure?
The standard error of the mean (SEM) estimates the variability inherent in a sample statistic such as the mean. It measures how accurate our estimates are, based on how consistent results from repeated sampling would be. By calculating the SEM, we can get an idea of how much confidence we can have in a particular sample statistic or set of data points. This information is invaluable for deciding which conclusions to draw from a dataset.
Conclusion
The Standard Error of the Mean (SEM) estimates how much error there is in a given data set. The Standard Deviation (SD) measures how spread out the data are. The SEM is always smaller than the SD because it only considers the variability within a given set of scores, not the variability between scores. When you see results reported with a standard error, they usually refer to the SEM.
Advertisement

Rick Novak Sep 04, 2024
Exploring Your Student Loan Repayment Choices
56628

Kelly Walker Oct 12, 2024
Fidelity National Home Warranty Review
10174

Kelly Walker Nov 03, 2024
When A Stock Splits, What Happens To The Option On That Stock?
37103

Rick Novak Oct 23, 2024
Which One To Buy: Stocks or Bonds
57619

Kelly Walker Aug 05, 2024
Profit Margin vs. Markup: What's the Difference?
40492

Kelly Walker Aug 04, 2024
Silicon Valley: Why Is It a Startup Heaven?
30202

Kelly Walker Aug 04, 2024
Top Insurance Options for Hurricane Protection
59765

Kelly Walker Nov 07, 2024
Top Mutual Funds
32836